Observations
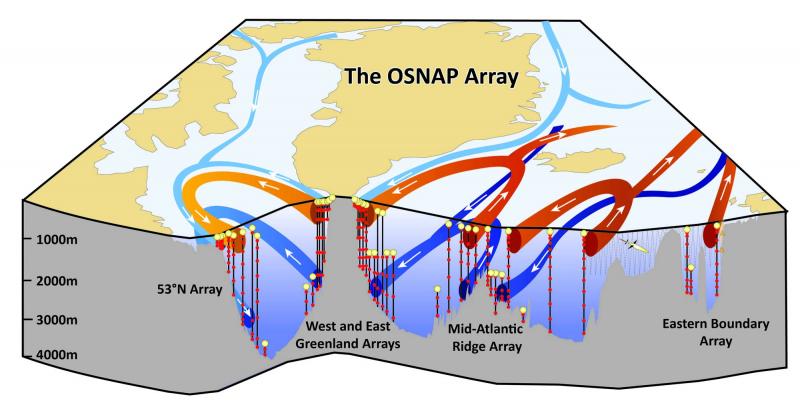
To measure Subpolar Gyre circulation and fluxes, OSNAP is configured as a transatlantic observing system comprising moored CTD and current meter arrays, hydrographic sections and gliders.

The full OSNAP array is shown in this diagram. The OSNAP line consists of two legs: OSNAP West extends from south Labrador to southwest Greenland, and OSNAP East from southeast Greenland to Scotland. Flow through these lines will be connected via subsurface RAFOS floats that will track the pathways of the overflow waters and help interpret observed variability in fluxes across the OSNAP lines.

During 2014 to 2018 the UK-OSNAP array contributions were the Cape Farewell Deep Western Boundary Current array, and the Eastern Boundary array. Both were first deployed in summer 2014, the instruments recovered and replaced in 2015 and 2016. The Eastern boundary moorings were serviced in 2017, and all components were recovered in 2018.
From 2018 to 2020, UK OSNAP is operating moorings in the Iceland Basin, while the Eastern Boundary moorings (Rockall Trough) are operated under National Capability programme CLASS.
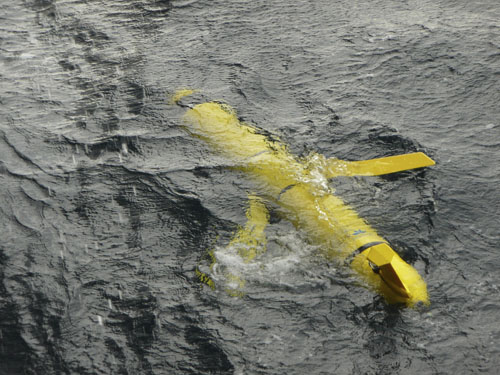
The Eastern Boundary Array consists of continuous presence gliders as well as moored insturments. During 2014-2018 UKOSNAP ran 11 glider missions, producing a unique and fascinating dataset.
In summer 2014 the UK conducted a hydrographic section along the OSNAP line collecting physical and biogeochemical data (cruise JR302). The cruise contribute to GO-SHIP, the NERC-funded RagnarocC programme, and the Extended Ellett Line programme.

The OSNAP array will make essential and accurate measurements of the Subpolar Gyre mass transport. It is also clear that for heat and freshwater fluxes, Argo float profiles will critically complement the OSNAP array. Horizontal ocean fluxes of heat and freshwater are carried both by the mean flow and the eddy field, and the quantity and significance of eddies in the Subpolar Gyre are well recognised. We will construct robust seasonal estimates of the 3-D Subpolar Gyre circulation and the distribution of isopycnal and diapycnal mixing in the upper 2000 m in all four sub-basins: the Labrador Sea, the Irminger and Iceland Basins, and the Rockall Trough.
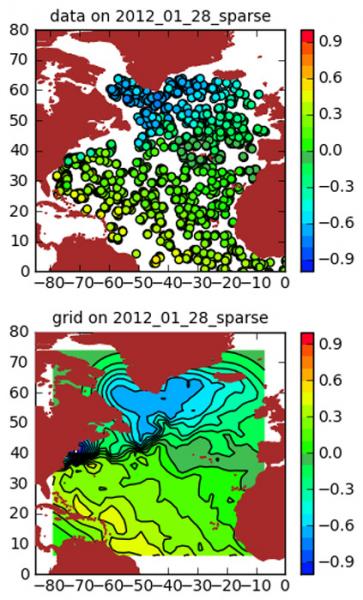
The figure to the left shows an example of what we can do with data from Argo floats; the top panel shows a coloured circle indicating the sea surface height calculated from the float data at the location of each profile. The bottom panel shows the mapped field of sea surface height; this tells us about the circulation.


